Adjusting for inflation, students today have paid less and borrowed less money to cover the price of net tuition than their peers throughout the last 20 years thanks to increasing avenues of financial aid, according to a comprehensive report from the College Board, “Trends in College Pricing and Student Aid 2024.”
Colleges and universities distributed over $160 billion in grant aid to undergraduate and graduate students in the 2023-24 academic year. Over half (52%) came from the institution, 28% came from the federal government, and 9% from state sources. Since 2013-14, institutional grant aid for all students rose by $19.6 billion (in 2023 dollars), reaching $82.8 billion.
Federal appropriations and government grants and contracts per student increased by 38% at public doctoral institutions between 2016-17 and 2021-22, after adjusting for inflation. It more than doubled at other types of public colleges and universities. Furthermore, the maximum Pell Grant awarded to students last year increased by $500, which is the largest one-year increase in the past 15 years.
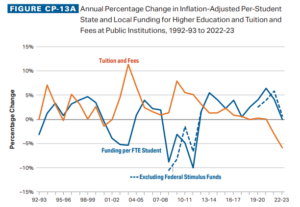
At the state and local level, funding per student has increased consecutively from the 2012-13 academic year to 2021-22, after adjusting for inflation.
While the precipitous rise in financial aid, particularly at the federal level, can be partially explained by emergency relief funds distributed after the pandemic, long-term trends illustrate intentional buy-in. The net price full-time students attending four-year private institutions paid in 2024-25 has declined by almost 15% since 2006-07. At four-year publics: 43%.
And first-time full-time public two-year college students have received enough aid to cover their tuition and fees since 2009-10. Over the last 30 years, total state and local funding increased by 54% after adjusting for inflation, total public FTE enrollment increased by 25% and funding per student increased by 23%.
As the rate of aid has increased, student borrowing has decreased. Less than a quarter (24%) of undergraduate students borrowed federal loans in 2023-24, down from the 38% peak in 2011-12. Between 2017-18 and 2022-23, the average cumulative student debt level per borrower declined across the public and private non-profit four-year sectors.
Sticker price vs. net price
While average published tuition and fees, commonly known as an institution’s sticker price, doubled in the public sector since the 1994-1995 academic year, inflation-adjusted tuition and fees have declined by 4% in the previous decade. Despite claims of skyrocketing sticker prices across the private sector, it has risen by only 4% in this same period.
Nevertheless, increases in net prices students have to pay after receiving financial aid have been smaller than increases in the published sticker prices since 1994-95.

Trends in College Pricing and Student Aid 2024, New York: College Board.
© 2024 College Board.
More from UB: See the two pictures enrollment is painting this fall

