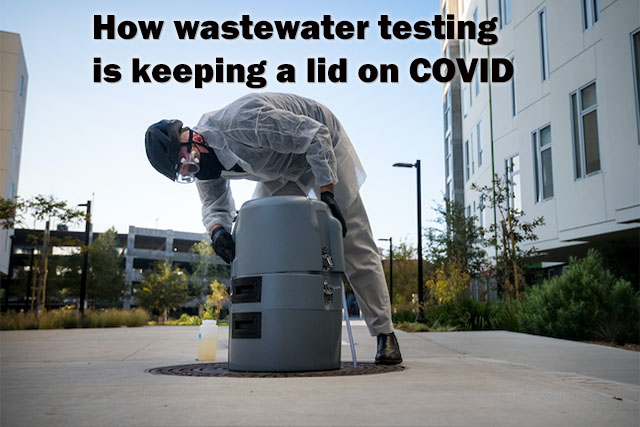
The COVID-19 pandemic has impacted global public health response in unprecedented ways, underscoring both shortfalls and the need for innovative solutions. For micro-communities like university and workplace settings, this reality is especially true.

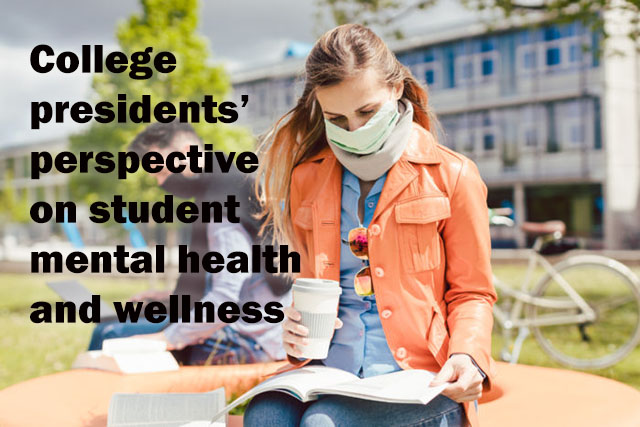
When most college campuses reopened in fall of 2020, administrators spent the semester fluidly adjusting plans as dynamics around the virus changed. Now, as the U.S. turns the corner into 2021 and campus leaders reflect on the effectiveness of strategies, one area that consistently rises to the top of priorities is the need for good data—highly granular insights that inform optimal decision making within the confines of a college campus.
The challenge is significant. Research suggests that one-third of viral respiratory infectious disease transmission occurs in schools and workplaces[1]. Foundationally, college administrators must be able to gauge the risk associated with an infected, yet asymptomatic, employee or student who introduces risk to anyone they interact with on a given day.
Lab insights: the foundation for optimal response
By now, college administrators and boards have put in place appropriate protocols to address safety. These likely include social distancing, mask-wearing, symptoms checking, isolation measures and monitoring.
Along with these measures, educators need access to data that moves response from reactive to proactive. In spring 2020, a coalition of commercial and health system laboratories and technology partners began collaborating on ways to provide a wide array of stakeholders with detailed lab testing insights to improve this outlook. The result was a powerful dashboard that is free to the public and produces granular insights derived from COVID-19 test results from more than 20,000 lab ordering sites across 3,007 U.S. counties and numerous sub-county areas known as PUMAs (Public Use Microdata Areas).
Part of the dashboard, the Local Risk Index™ (LRI), can serve as the earliest indicator of change in COVID-19 exposure risk at the county and sub-county levels. It also features a side-by-side view of viral and antibody testing as well as local-risk and age-group trending at the national, state, county and sub-county levels.
College administrators can simply click on the appropriate state from the U.S. map on the home page, then click on the “drill down” link in the pop-up box and select county or PUMA. The county LRI Trend line shows if the risk is going up or down based on positive test results in that area, and the 7-day Rolling Trend will show if the risk of exposure is high and rising (red) or low and falling (green).
Next steps for college campuses
With protocols in place, colleges and universities must also have systems for ongoing monitoring that ensure proactive alerting to potential issues or an uptick in risk. Foundationally, local insights derived from the LRI can inform optimal employee and student-specific decisions that are based explicitly on the risk levels found in communities where they live.
If the LRI data trends indicate a higher risk environment of contracting COVID-19, administrators can smartly react to protect employees and students. For example, if an individual is entering the campus from an area with an elevated LRI, reactions may include:
- Close monitoring for symptoms, e.g. temperature checks and/or researching exposure.
- Bi-weekly testing to discover asymptomatic cases.
- Requiring enhanced use of masks and social distancing.
- Allowing remote work or school until the LRI decreases for 10 days.
Knowledge is power, yet many colleges are challenged to allocate the resources needed to guarantee a data-driven approach to oversight while juggling data security, privacy, and compliance requirements. The good news is that the LRI can be used to power COVID-19 return-to-campus solutions that deliver critical information in a meaningful, actionable way by bringing together test results tracking, symptom data, and other insights on the micro-community level—as well as real-time identification of building, floor, and/or wing where an infected individual is located or has visited[2].
[click_to_tweet tweet=”A Local Risk Index can be used to power COVID-19 return-to-campus solutions by bringing together test results tracking, symptom data, and other insights on the micro-community level. #highered” quote=”A Local Risk Index can be used to power COVID-19 return-to-campus solutions by bringing together test results tracking, symptom data, and other insights on the micro-community level. #highered”]
With permission, the test results of a student or employee are immediately transmitted from a lab to the solution. Campus administrators are alerted when action is required, allowing immediate intervention, including isolation, to minimize potential spread.
While valuable at the state and national levels, the true power of the LRI is its ability to inform actionable insights that can enhance micro-community decision-making with continuously updated ‘hyper-local data’. By enabling rapid access to the right information, the LRI has become the foundation of a comprehensive, holistic approach that drives faster public health response, better outcomes, and the ability to safely keep campuses open.
Peter J. Plantes, M.D. is a physician executive with hc1. He has three decades of experience creating service and delivery solutions that enhance marketplace success and clinical performance for clinical practice groups, academic faculty group practices, hospitals, health systems and health-care organizations.
[1] Mossong J, Hens N, Jit M, et al. Social contacts and mixing patterns relevant to the spread of infectious diseases. PLoS Med 2008;5(3):0381–91.
[2] Plantes, P. A case for hc1 Workforce Advisor. hc1. (https://www.hc1.com/blog/a-case-for-hc1-workforce-advisor/)