
Virtually every campus department at every institution has, by this point, gone through at least one round of correcting operational inefficiencies. The result: fewer paper-shuffling processes.
Often, leaders of campus offices have realized that saving time and money also leads to better service and contributes to student success. “It’s our responsibility as administrators to make sure the dollars entrusted to us improve student outcomes,” says James Schmidt, chancellor of the University of Wisconsin-Eau Claire.
Kevin Ciotta, principal with the Philadelphia-based higher educational consultancy JM Associates, adds, “The idea is that students shouldn’t have to learn a school’s organizational structure to pursue a service.” That philosophy has led many campuses to set up one-stop shops for student services. Today, the process of fixing inefficiencies typically means going beyond low-hanging savings—such as automating paper-based systems—and getting creative about process, or tweaking or overhauling a department. Administrators also use the abundance of data and data analysis tools now available to gain insight into improving operations.
The following three examples detail savvy and successful efficiency initiatives.
Valdosta State University (Ga.): Boosting enrollment while improving student services
Challenge: Valdosta State regularly lost a significant portion of prospective students. The fact that more than 40 percent of those calling for assistance—with transcripts or application status, for instance—didn’t reach a representative likely contributed to this, says Benjamin Li, assistant director of IT services. The average wait time was 30 minutes.
Moreover, admissions staffers spent so much time fielding calls, they were unable to participate in many recruiting events. Even once students reached a representative, the calls averaged 10 minutes. Each piece of information, such as the caller’s transcripts or test scores, sat in a different area of the student information system. In some cases, representatives were toggling among 16 pages, Li says.
And to make things more confusing for callers, admissions, IT and financial aid each had their own call centers.
Solution: In 2016, Valdosta’s Solutions Center opened to handle IT, undergraduate admissions and the welcome center. The welcome center fields calls on everything from university directions to area hotels. All information related to a student appears on a single page in the system. It’s also color-coded, so a missing test score appears in red, for instance. “In 30 seconds, you can identify the next step,” Li says.
Process: In-house programmers developed the platform now in use, Li says. A solutions center liaison communicates regularly with admissions and IT to ensure that the systems remain up to date with all procedures and policies. Setting up the center’s headquarters required a one-time investment of $45,000, with annual software and internal developer costs totaling $12,000.
The number of calls nearly tripled, jumping from 24,000 to about 70,000 annually. To manage this, the center added just one full-time employee and four part-time assistants, bringing its staff to four FTEs and 12 student assistants.
Benefits: The average call time fell from about 10 to 2.5 minutes, bringing the previous abandonment rate of 40 percent down to 4 percent. Employees in recruiting can attend more events. Largely because of these changes, freshman enrollment jumped 12.5 percent in the center’s first year. Call handling costs dropped from $2.25 to $1.30 per minute. With approximately 180,000 call minutes per year, that represents a savings of more than $170,000.
Related: Centralizing faculty support staffing at the University of Wisconsin-Milwaukee
University of Wisconsin-Eau Claire: Remembering overarching goals
Challenge: In 2015, a proposed and significant drop in state funding would have led to a $12.4 million deficit in the university’s $90 million general operating budget, Chancellor James Schmidt says. Administrators launched an efficiency initiative that has saved resources while also resulting in better collaboration among student services departments. “Across-the-board cuts are for lazy administrators,” Schmidt says. In identifying areas to tighten, officials tried not to disrupt four goals, which were identified by these numbers:
- 100 percent graduate participation in at least two high-impact activities (e.g., research, internships, study abroad)
- 90 percent freshman-to-sophomore retention rate
- 50 percent student graduation in four years
- 20 percent student of color population
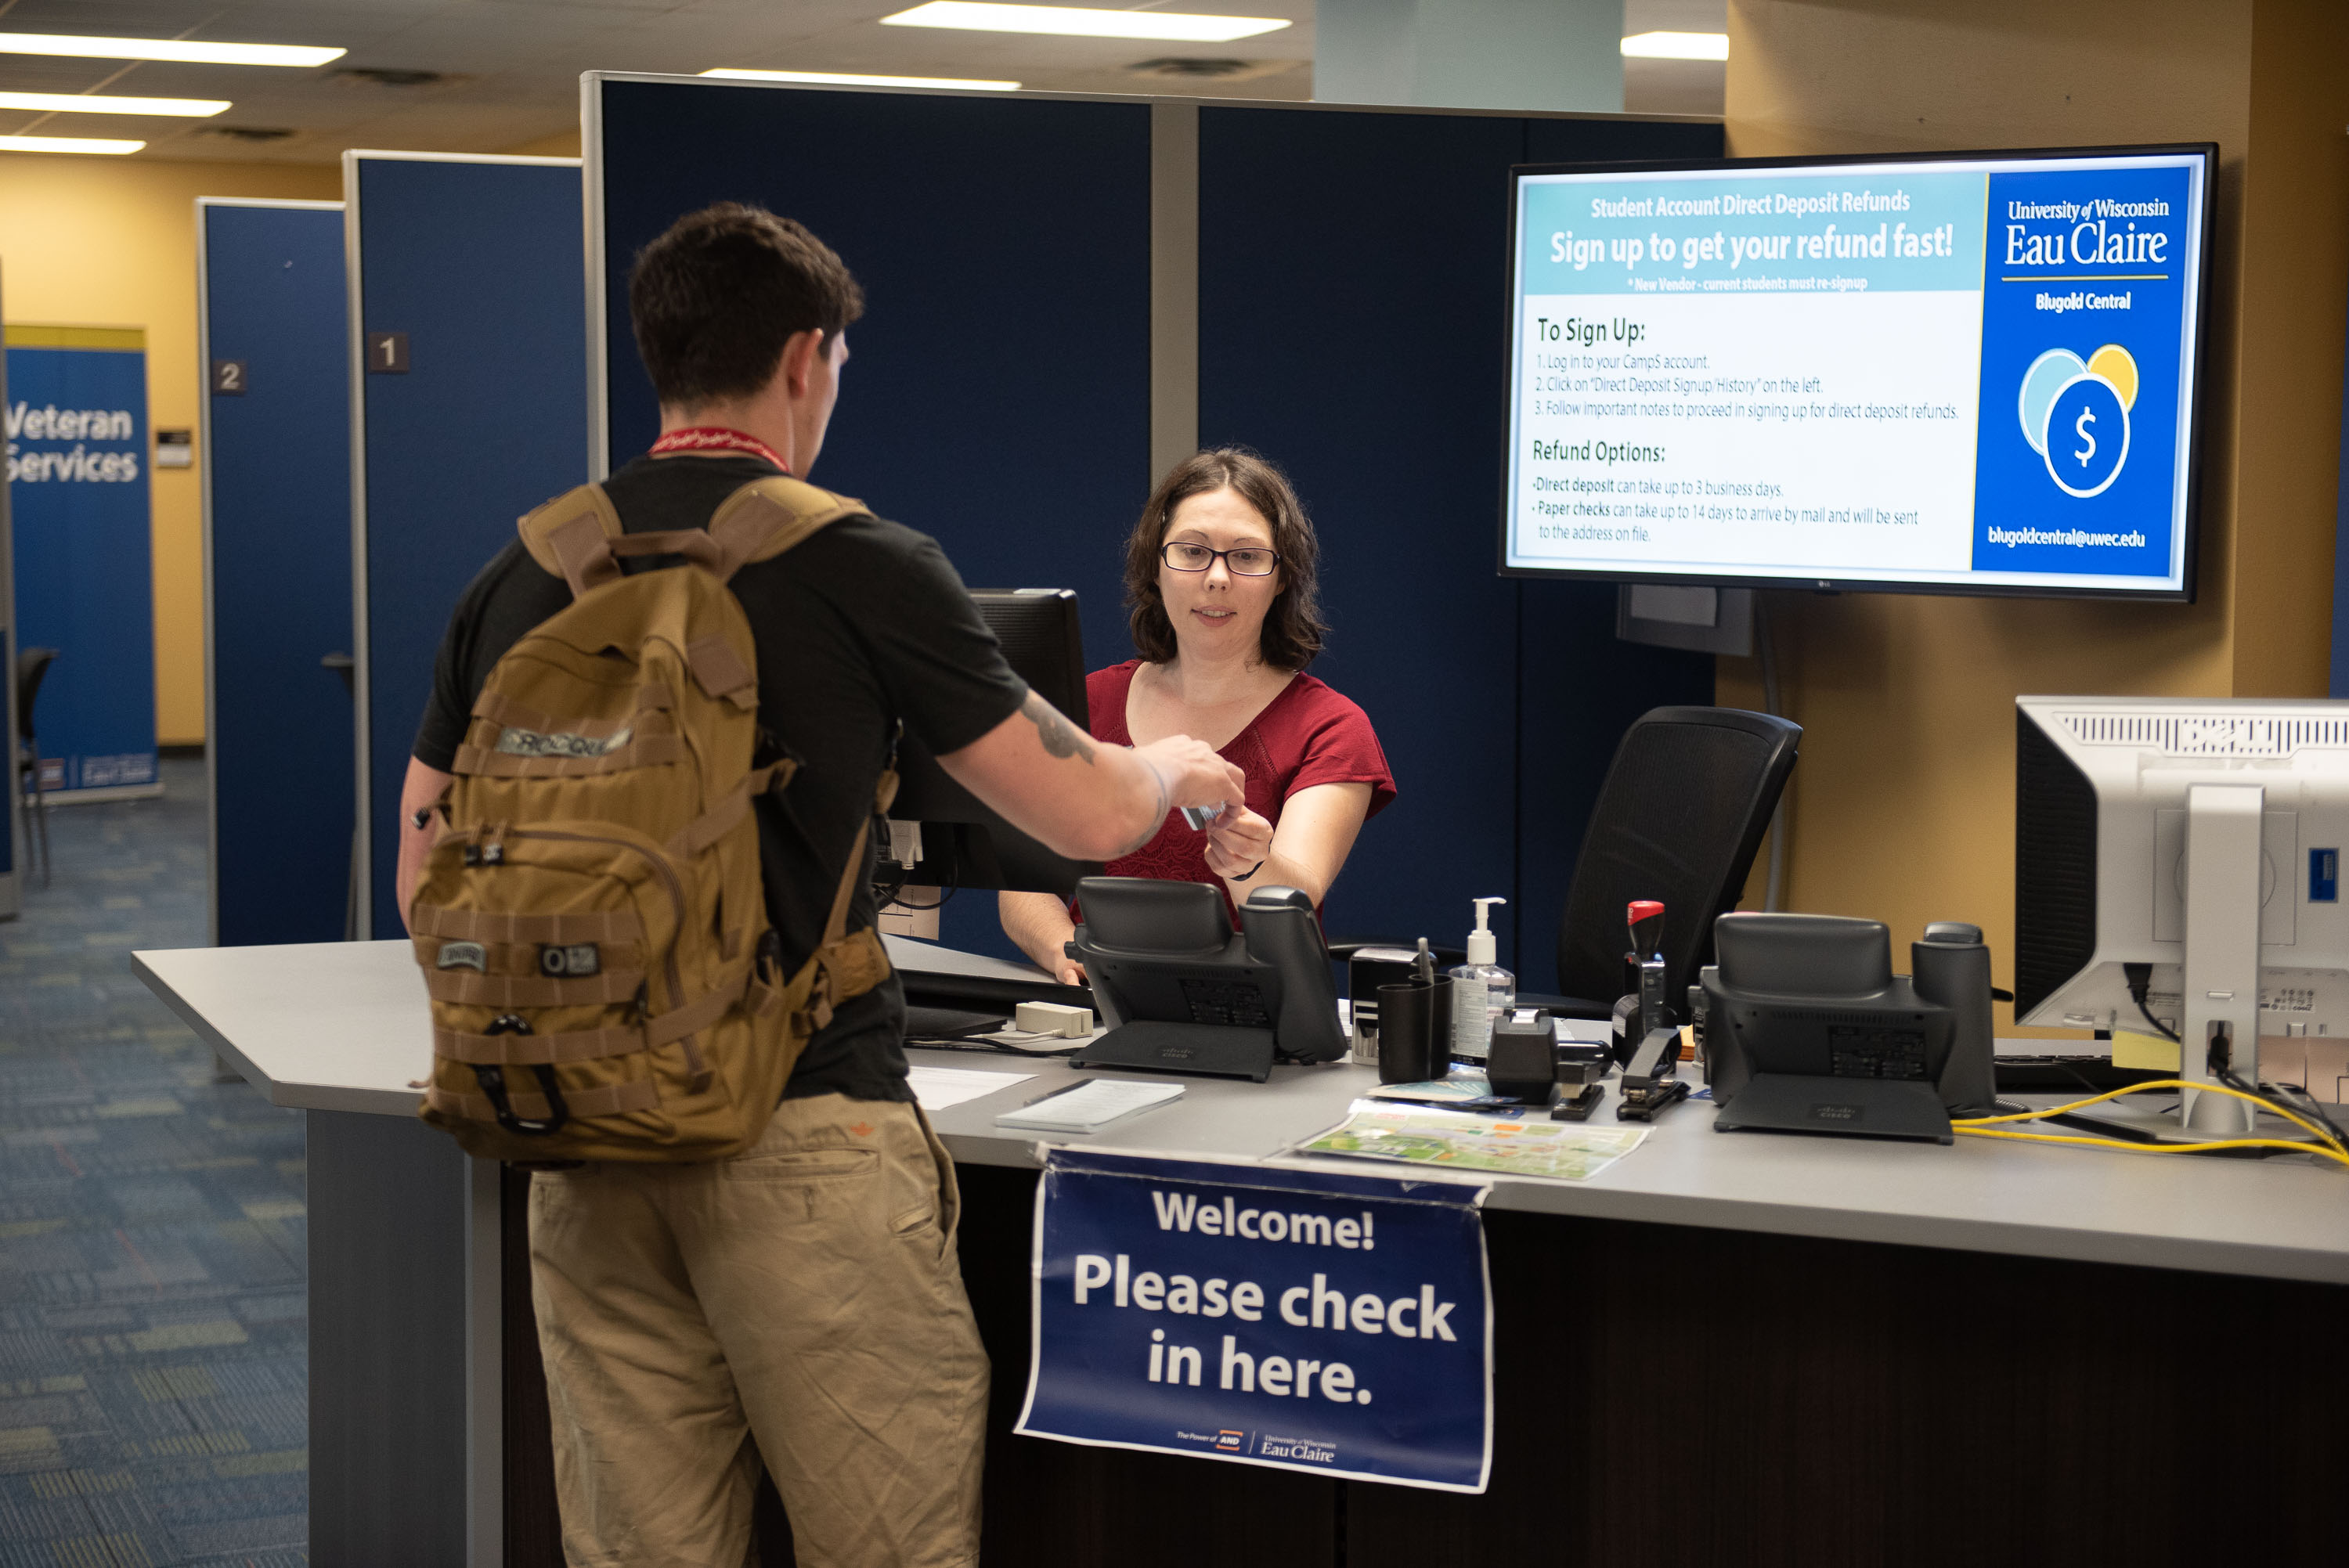
Solution: Schmidt focused on centralizing operations, reducing red tape and maintaining a customer focus. One result is Blugold Central, a one-stop student services department that handles class registration, bill payments, financial aid questions, continuing education and other functions. New technology enables online payments and direct deposit of checks. Both the student-facing and back-office operations are centralized. So information in the system—such as a check for a scholarship payment—is available to all departments. Previously, such a check may have been scanned several times. In 90 percent of Blugold Central interactions, a generalist helps the student, but specialized assistance is available.
Process: Schmidt organized four rapid-action task forces, and gave them 30 days to determine how to make cuts without hindering academics and progress toward the four goals.
He sought “creative thinkers who’d think about the university as a whole,” he says. They included faculty, staff and students.
The groups focused on four areas: administrative redesign, student services, academic workload and curriculum. Instead of trying to “do more with less,” Schmidt was forced to aim for “less with less.” That is, the university would have to de-emphasize some areas, such as in-house trades work. As part of this, they eliminated nearly 100 positions.
Benefits: The university returned to a balanced budget within a year, while serving students more effectively. For instance, the average time to process scholarship checks dropped from nine to 2.2 days. Moreover, housing numerous functions under one roof has made it easier for students to get help. “We used to put the onus on students to connect the dots,” says Nikki Andrews, Blugold Central director. “Now, we help to connect the dots.” The university’s four-year graduation rate, once 26 percent, is now at 41 percent. And Blugold Central staff, who are part of the enrollment management division, now have the ability to more easily collaborate on topics of relevance for both incoming and continuing students, such as the financial aid process, Andrews says.
Related: How Pueblo Community College in Colorado used scholarship donation funds to increase tuition revenue
University of North Texas: Using analytics to improve decision-making
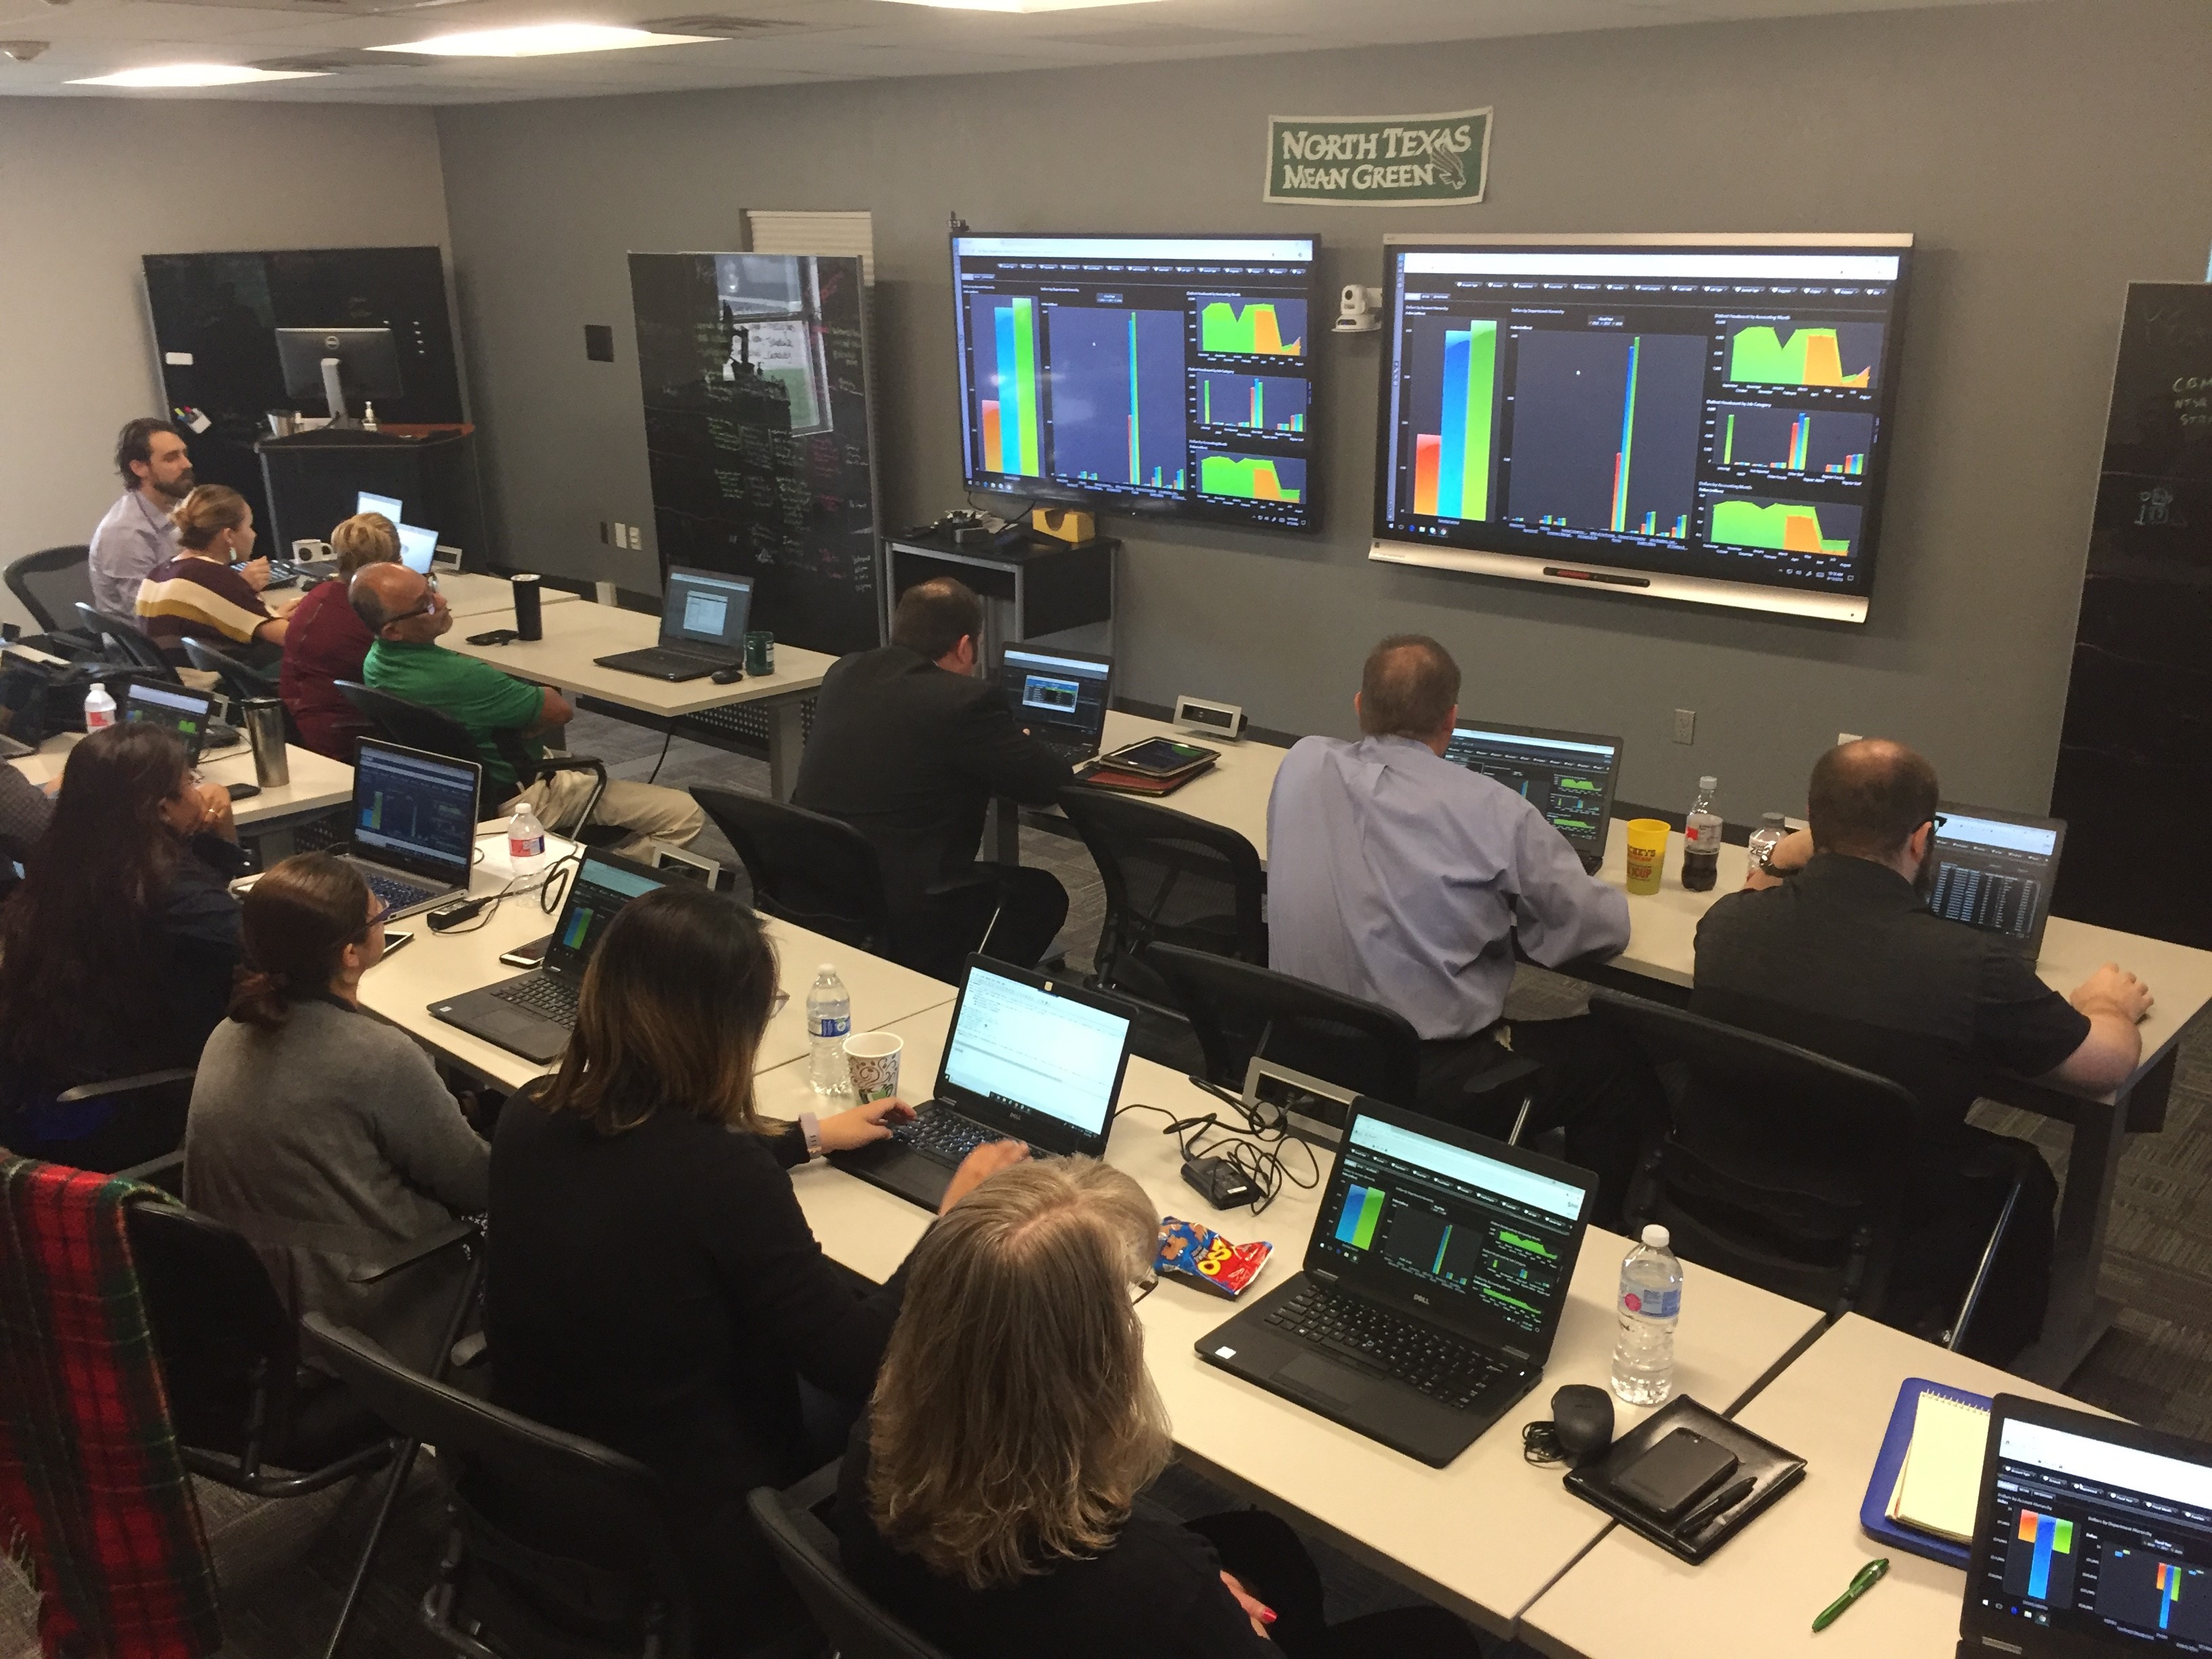
Challenge: The University of North Texas had plenty of data. A case in point: A spreadsheet showing the drop, fail, withdraw and incomplete rates came to 75-plus pages per semester. However, administrators lacked insight. “We were asking individuals to find the needle in the haystack,” says Jason Simon, assistant vice president for data, analytics and institutional research. Leveraging data, rather than “gut feel,” in making big decisions was the goal, Simon says. That required reporting capabilities that looked across the organization and provided “a single source of truth.” The IT solution also had to be easily and quickly accessible, and secure.
Solution: An enterprisewide data and analytics platform, UNT Insights, incorporates about a dozen analytics products used by staff. “We moved away from basic spreadsheets to drillable, interactive dashboards that allow us to see patterns,” Simon says.
Process: Decision-makers in enrollment, institutional research and academics spent about 1 1/2 years discussing the challenges of using data. From this, Simon and his team developed an analytics framework with assistance from SAS, a provider of business intelligence and analysis tools.
Benefits: North Texas has seen a return of $1.31 for each dollar spent on UNT Insights, a result of reduced costs, increased efficiency, and higher graduation and retention rates, Simon says. For instance, data visualization more clearly revealed four-year trends in drop, fail, withdraw and incomplete rates as well as patterns of success and struggle, broken down by majors and courses.
Administrators also discovered where additional tutoring or other assistance would be most beneficial. Initiatives based on these findings have boosted retention rates among first-time and transfer students, leading to an estimated $450,000 in revenue that would have been lost.
Simon and his team also overlaid a map of off-campus student housing with a map of transportation routes. Within minutes, they found bus routes that could be eliminated without significantly reducing service. That produced almost $450,000 in additional savings.
Karen Kroll is a Minnesota-based writer.