
While the effects of COVID-19 have yet to be fully realized throughout higher education, it is clear that institutional budgets have already been negatively impacted, while administrators frantically look for new and different ways to increase revenues and control costs.

One way in which institutions and system offices try to manage the costs of higher education is to look at how various academic programs or departments are performing. Traditionally, this is accomplished by counting degrees conferred over time. In fact, according to the National Conference of State Legislatures, in those states that have performance-funding models, most count the number of graduation completions over time.
While counting degrees addresses an important component within an academic area, it fails to consider other factors such as how many majors are present to replace students who graduated or how many credit hours were generated by the area. A variability index, therefore, can consider each of these factors by combining two simple matrices.
The first metric is called the replacement ratio. It is the quotient of the number of majors within an academic area divided by the number of graduates from that same area. Therefore, an 8-1 ratio simply means that eight majors exist for every one student who graduated. It is common knowledge that students may change majors, stop-out, or drop out of college so the replacement ratio gives a clear indication of an academic area’s strength in the recruitment and retention of students. In general, ratios between 6-1 and 10-1 indicate strong programs while ratios significantly higher can signal attrition and lower ratios may signal dying programs.
The second metric is called the production ratio. This ratio computes the total number of credit hours produced by an academic area as a percentage of total credit hours generated by the institution. This metric is important because, not only does it reflect the revenue an academic area is generating, it also takes into consideration those areas that may not have a lot of graduates but produce a lot of credit hours by supporting the institution’s core curriculum and other requirements.
The Viability Index simply becomes the product of the two ratios and can be expressed as:
Viability Index = (Majorsj/Degrees Awardedj)*((Academic Area CHRSj/Institutional CHRS)*100)
The resulting index is expressed as mixed numbers (whole numbers with fractions) where a higher number indicates greater viability. While this index can be created from a common spreadsheet program, it displays vital information concerning the recruitment, retention, credit hour production and degrees conferred by an academic area.
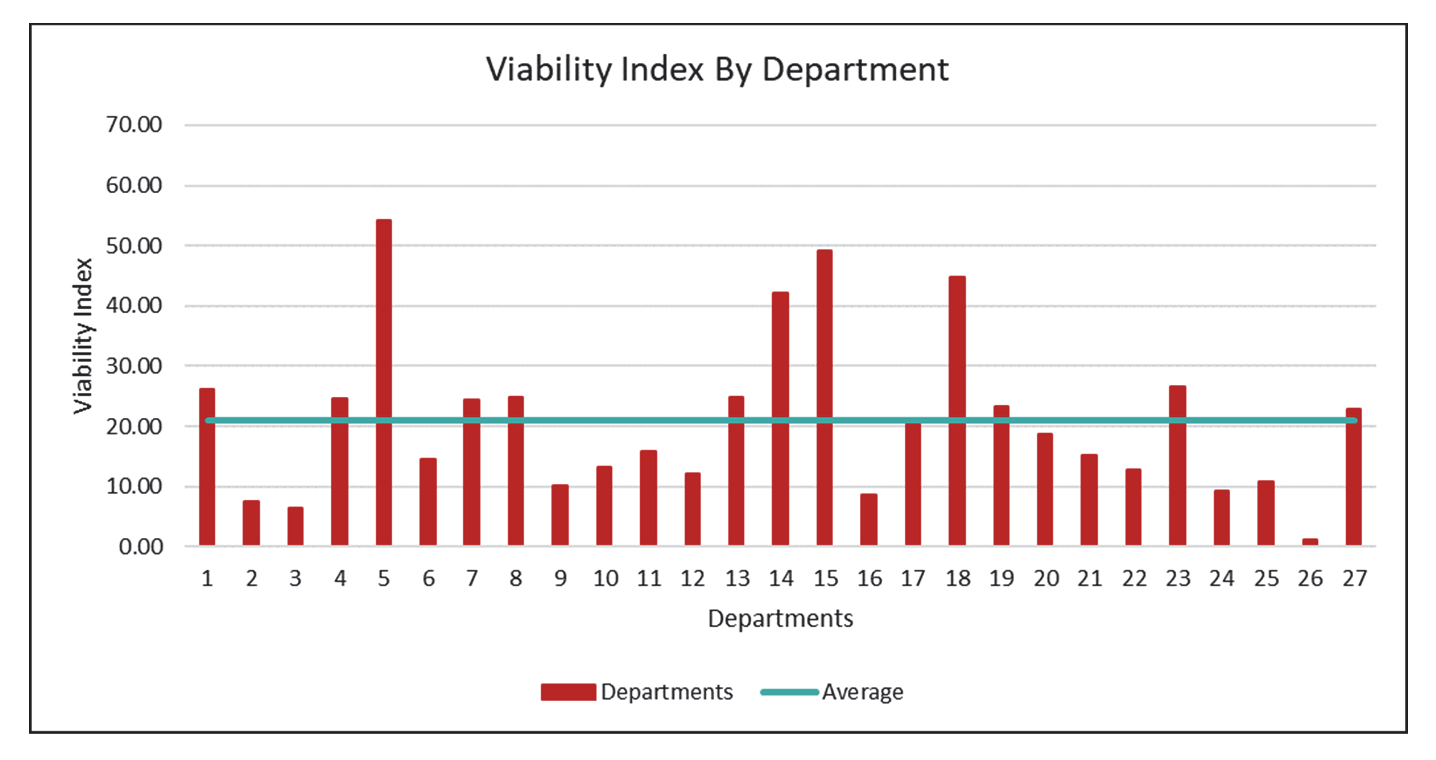
Looking at the table below indicates one way the Index may be used. Here, each academic department is depicted with its Index. An average line is included to show how each department relates to each other. While most of the departments plot close to the average, some are a good bit higher while others are much lower. Using this chart, administrators can quickly see those departments that are not performing well and can plan accordingly on how to address them. While the chart below indicates one year, the Index is especially useful when multiple years are charted and Index trends are compared over time.
Although the Viability Index by itself produces a lot of information about the strength of an academic area, an examination of expenditures is also important to understanding completely how well a program or department is doing. Some programs like science, engineering, and music cost significantly more to operate than do others. Therefore, departments with the same index may be considerably different regarding expenditures, and this factor should be taken into consideration when looking at overall health. To address this issue, the index could be easily used as a divisor with the departmental budgets to create a Cost Per Unit of Viability (CPUV).
For example, say Department A has a Viability Index of 20.02 and a budget of $1,102,054. The budget divided by the index would be a $54,557 CPUV. Department B has the same Index of 20.2 but a budget of $524,142. The CPUV for this department would be $25,948, which is considerably less than Department A. Therefore, the variability of budget numbers as compared to the Viability Index can give a dynamic and comprehensive overview of how a department is actually doing.
While the COVID-19 crisis has created unprecedented challenges for all higher education institutions, it has also given administrators greater opportunities to manage scarce resources while leveraging strengths to overcome future obstacles. The Viability Index can be one tool to help them meet their goals.
Andrew L. Luna is executive director of decision support and institutional research at Austin Peay State University in Tennessee. He can be reached at [email protected].


