There’s an urban legend that Henry Ford, creator of the commercial automobile, said, “If I would have asked people what they wanted, they would have said faster horses.” As creatures of habit, a technological leap can be difficult to adjust to. The same can now be said for today’s increasingly data-driven world.
Determined to leverage these tools in higher education, the University of North Texas and Reynolds Community College (Va.) are building a culture of faculty and administrators equipped to leverage AI-powered predictive analytics and data visualization products to strategize more effective enrollment tactics.
“Prior to having the tools in their hands, there was a big question mark. ‘Why is this a game changer?’ We already had tons of reports. Staff was churning out literally thousands of static PDFs out of my unit,” says Melanie Boynton, director of institutional research and analytics at Reynolds. “The internal selling we had to do was difficult, but now people really love these tools. This is the most data-informed they’ve ever been in their entire lives.”
Before North Texas had any analytics software suite, the administration’s only way to assess future recruitment and enrollment trends was by backtracking minute details and analyzing the only results they had – the ones that had already happened. Now, North Texas has 1,200+ trained employees, from administrative assistants up to the president, using their predictive analytics software suit to forecast trends years from now to make more informed decisions, says Jason Simon, associate vice president of data, analytics and institutional research at North Texas.
Preparing for the storm
Simon thanks his university president, Neal Smatresk, for modernizing North Texas’ enrollment strategies. “It takes effort and support from the top to achieve a higher level of analytic maturity,” he said. “There are some foundational hurdles that most institutions haven’t figured out how to get over yet.”
However, Simon believes schools may be running out of time to adapt.
“As we approach the demographic cliff of the traditional 18-24-year-old market, I believe that institutions that mature their analytics and invest in their people who know the data are probably going to fare a little better than those who are a little late to the party,” says Jason Simon, associate vice president of data, analytics and institutional research at North Texas. “I’m concerned for students. We all want to see us produce graduates.”
Making data human
Boynton is the first to admit that getting into the depth of an institution’s data can be overwhelming, and that’s precisely what makes their statistical software suit, SAS, such a game-changer for them. The real “tool” it provides, Simon argues, is its ability to take huge swaths of data and create a data model from it to drive clear, intentional decision-making. “Data is about storytelling,” he says. “Because it’s a visual approach to data, it allows us to tell stories very easily.”
Similarly, Boynton views the way leadership at Reynolds now makes strategic decisions as a blend of art and science. “Making decisions purely on your intuition or what the data says isn’t great,” she says. “It’s about balance.”
More from UB: Higher fees for higher ed: How schools are combatting newly proposed tuition hikes
Applying the technology
North Texas uses over 20+ analytic products to assist decision-making with academic performance, financial aid and budgeting to name a few. Let’s look at a few ways the two schools are using their data-literate staff to enroll its largest classes ever and increase graduation rates.
Recruitment
Matured analytic tools allow North Texas to leverage publicly available data to identify high-growth areas for competitive academic programs and how they stack up with other institutions. When deciding on adding or changing curriculum, administration has more to rely on than anecdotal evidence and intuition.
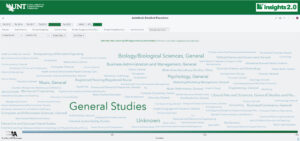
The figure below is an elegant, accessible calculation of the proportion of admitted students who enroll elsewhere, broken down by their intended academic program and number of enrollees. This helps administration know which of their programs need concentrated outreach efforts and program re-tooling.
Retention and persistence
- Simon partnered with North Texas’ division of student affairs to track traditionally aged college students in the fall semester who were involved and engaged in programs outside of the classroom. North Texas proactively reached out to students they identified were not contributing to extracurricular programs to assess how they were doing and if any follow-up actions were necessary if the student was indeed struggling.
- North Texas also has a “D, W, F, I” product that analyzes how many students—and what types of students (demographic, major, etc.)—are struggling with a particular class and with a particular teacher. Assessing student performance by teacher allows North Texas to gain an understanding of if the issue is a with particular student body or with a professor.
- Using SAS has allowed Reynolds to gain a better insight into their large pool of adult learners aged 41 years old and older. Reynolds already knew that this student body liked to take STEM courses. They used to employ student support measures across all 15 of their STEM subjects, straining resources. However, Reynolds now knows the majority of their adults take biology and math courses. Their support efforts are now efficient and strategic.
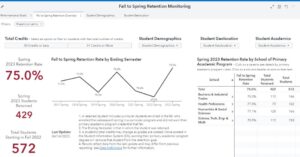
- Just as Reynolds uses SAS to identify adult learners, both institutions also use the product to identify how their students of all ethnicities and first-generation status are doing, combatting historical performance equity gaps that may have persisted at each school. Reynolds’ dashboard, as Boynton puts it, identifies the “where.”
“For groups out there who want to go on this journey, you’re going to go through that learning curve, and that question mark is going to be there,” Boynton says. “Now it’s a thing where if this thing doesn’t run, I’ll immediately get a message in the middle of the night asking what’s going on.”