")
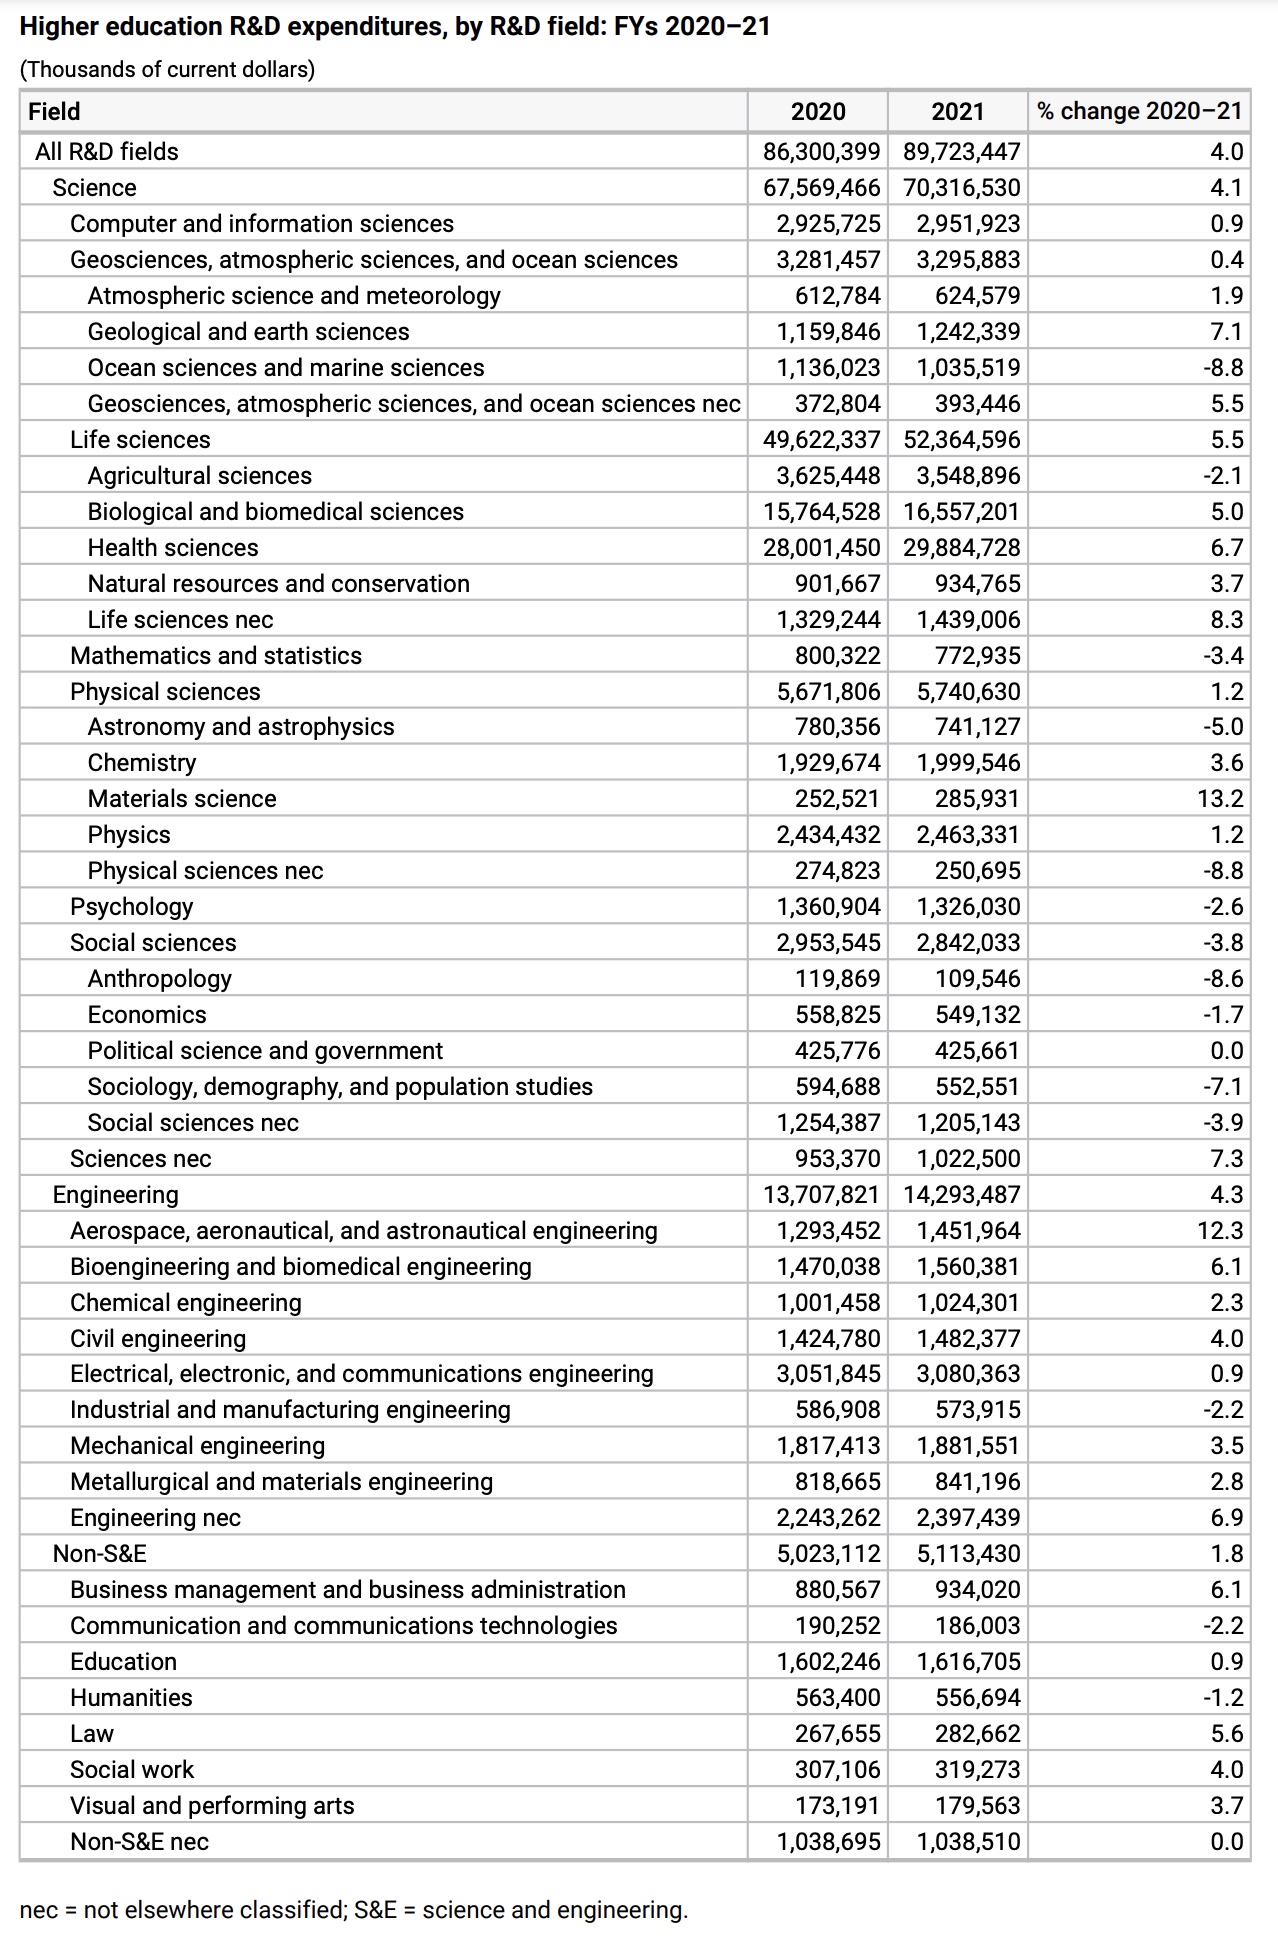
Innovation is alive and well on campus as R&D on campus is seeing increased investment by college and university leaders. Academic institutions spent $89.9 billion on research and development in math, science, engineering and other major fields during FY 2021, an increase of $3.4 billion from 2020, according to the latest data from the National Science Foundation.
Higher ed R&D got a jolt from the largest increase in federal R&D spending since 2011, when Great Recession relief funding came to the rescue. Campus leaders also reported increases in state and local contributions though nonprofit spending dropped, according to the latest Higher Education Research and Development Survey.
The top 30 R&D universities—more than half of which were public institutions—accounted for 42% of total R&D spending, a number that has remained consistent over the last several years. Twenty-four of those universities invested more than $1 billion and all but three reported R&D expenditures for their medical schools.
More from UB: More education leaders ban TikTok for students and employees
Vanderbilt University and Vanderbilt University Medical Center moved into the top 30 (see the full list below) after making changes to their accounting systems while the University of California, Berkeley fell off the list. More effective accounting also helped Ohio State University make a big jump—from No. 24 to No. 12.
Institutions that dropped down the list include the University of Minnesota, which slipped two positions even though the flagship spent $31 million more on R&D in 2021. The Massachusetts Institute of Technology moved down six positions to No. 29 after a decrease in R&D spending.
The top 30 R&D performers:
- Johns Hopkins University: $3.2 billion
- University of California, San Francisco: $1.7 billion
- University of Michigan, Ann Arbor: $1.6 billion
- University of Pennsylvania: $1.6 billion
- University of Washington, Seattle: $1.5 billion
- University of California, Los Angeles: $1.45 billion
- University of California, San Diego: $1.42 billion
- University of Wisconsin-Madison: $1.4 billion
- Stanford University: $1.3 billion
- Harvard University: $1.25 billion
- Duke University: $1.2 billion
- Ohio State University: $1.2 billion
- University of North Carolina, Chapel Hill: $1.2 billion
- Cornell University: $1.2 billion
- Yale University: $1.2 billion
- Texas A&M University, College Station and Health Science Center: $1.1 billion
- University of Maryland: $1.1 billion
- University of Pittsburgh: $1.1 billion
- University of Texas M. D. Anderson Cancer Center: $1.1 billion
- Georgia Institute of Technology: $1.1 billion
- Columbia University in the City of New York: $1.1 billion
- University of Minnesota, Twin Cities: $1.1 billion
- New York University: $1.1 billion
- Vanderbilt University and Vanderbilt University Medical Center: $1.billion
- Washington University in St. Louis: $989 million
- Pennsylvania State University, University Park and Hershey Medical Center: $971 million
- University of Florida: $960 million
- University of Southern California: $956 million
- Massachusetts Institute of Technology: $949 million
- Northwestern University: $913 million
Check the chart below for R&D spending in specific academic fields: